Frontend Mentor · Aug 17, 2022 · 1 min read
Expenses Chart Component
Expenses Chart Component
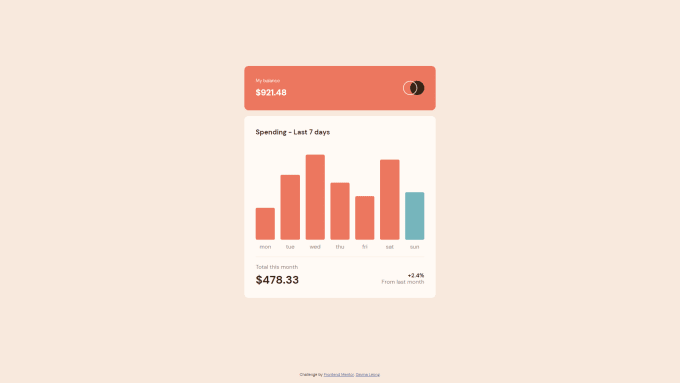
An interactive expenses chart component that visualizes weekly spending data with dynamic bar charts and hover interactions. This Frontend Mentor challenge demonstrates data visualization techniques and JSON data handling.
Key Features
- Interactive Charts: Hover effects on chart bars
- Dynamic Data: JSON-based chart data rendering
- Visual Feedback: Highlighting current day and peak spending
- Responsive Design: Chart adapts to different screen sizes
- Data Calculations: Automatic percentage calculations and totals
Technologies Used
- HTML5
- CSS3 (Custom Properties & Flexbox)
- JavaScript (ES6+)
- JSON data handling
- Dynamic DOM manipulation
Chart Features
- Dynamic bar height based on data values
- Hover state interactions
- Current day highlighting
- Peak value identification
- Responsive chart scaling
Data Visualization
- JSON data parsing and rendering
- Percentage-based chart scaling
- Color coding for different states
- Interactive hover tooltips
- Mobile-optimized chart display
Links
0